People have increasingly embraced renewables, especially solar, over traditional fuels. Solar energy is one of the promising hopes of many as the world advances toward better reliable alternatives. However, there are many hindrances to it. And one of them is the low capacity factor of solar. The capacity factor is something we should never ignore while judging solar energy. It is a very important aspect to understand whether you are an individual, installer, or buyer.
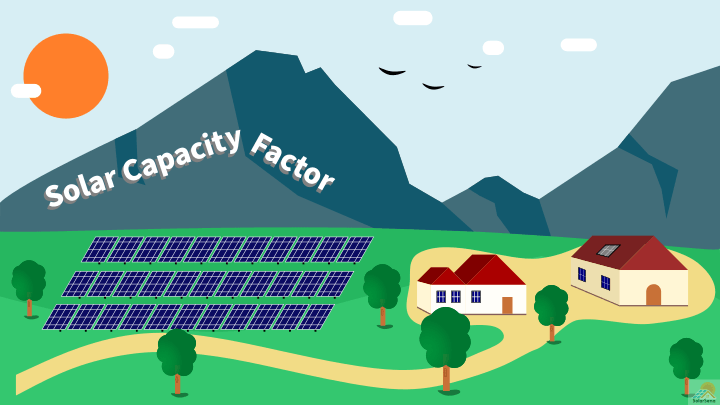
What is the solar capacity factor?
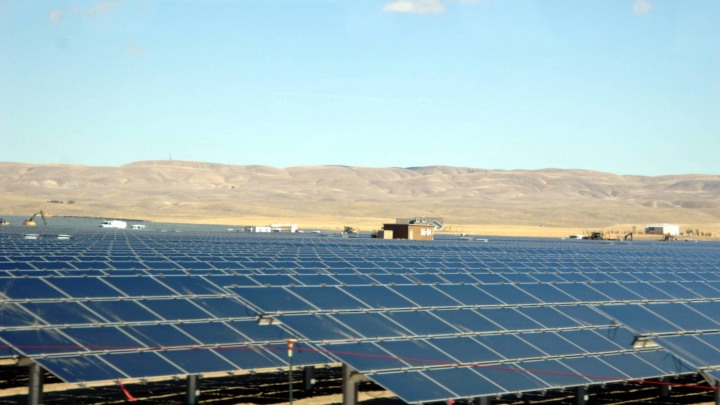
The solar capacity factor is the ratio of the actual power produced by a solar system in a particular period of time to the maximum possible power that can be produced by the system. As it is a ratio of the same quantities, it is unitless and expressed in percentages. The typical values of the solar capacity factor are between 10% and 25%. For the solar utility power plant, solar capacity is around 24.5%.
The solar capacity factor of a particular system tells how often the system is running. The higher the value of the capacity factor, the better the performance of the system. The ideal value is 100% for any system. But in the real world, the solar capacity factor never exceeds 40%.
Consider the following example. Assume your roof has five solar panels, each rated 200 W. So, the maximum capacity of your photovoltaic system is 5 × 200 W = 1000 W (1 kW). That is the maximum solar power you could have from your system. However, your system, in practice, will always generate power below 1000 W because of the capacity factor. Let us assume the solar capacity factor is 20%. So, you will get power equal to 1000 W × 0.20 = 200 W. The number is sad to believe, but it is true. You need to have five solar panels to generate the power equivalent to one solar panel. That is why a low capacity factor is a major problem in solar technology.

Although the above example illustrates a photovoltaic system, we could arrive at a similar conclusion for a solar thermal system.
What does the capacity factor signify?
The capacity factor tells us the net electricity generation over a particular period of time. It is also defined for other power sources, like nuclear, coal, geothermal, wind.
Manufacturers can size the system to whatever wattage they want. But in operation, it will never produce power equivalent to the designed capacity. The designed capacity assigned by manufacturers is also called the nameplate capacity. So, the solar capacity factor is the ratio of actual solar power generation to the nameplate capacity.
The capacity factor should not be confused with efficiency. You can have a very efficient system yet having a low capacity factor.
If a system has a lower capacity factor, it means the system is not operating continuously. There can be many reasons behind it, such as frequent shutdowns, unscheduled maintenance, the lack of fuel supply, economic factors, the low demand for power. In the case of solar, it is mainly due to the lack of availability of the sun, which we will discuss in the next section.
Since the capacity factor measures how much capacity we can utilize, it is also called the capacity utilization factor.
What parameters affect the solar capacity factor?
Now you know solar technology has a low capacity factor. But a question that pops up in the mind of readers is why solar has a low capacity factor. In this section, we will cover parameters that affect the solar capacity factor.
Solar technology—photovoltaic or thermal—is completely dependent on the sun. As the sun is not always available, the solar system could not produce power at all the time. Particularly, at night, we have no sun, so no solar power. The solar system will make no power in the dark. Because of that, we cannot utilize the solar system at all times. The electrical energy produced over a certain period of time will always be less than the maximum electrical power that the system can make. It decreases the numerator in the ratio, and the capacity factor decreases.
Below are other parameters that reduce the solar capacity factor.
Seasons and weather
Seasonal variations are an unavoidable issue in solar technology. They have adverse effects on the performance of the system. The solar irradiance received in a particular region will vary season-to-season. Further, unfavorable weather conditions, like rain, snow, hail, fog, scatter the intensity of solar energy. In summer, which is the most favorable period of the year, solar power generation is very high, whereas winters have lower solar power generation. This can be seen from the below graph.

At the beginning of the year, the capacity factor is pretty low, around 10 to 15%. The value ascends as summer approaches. In the graph, we can see the peak in the month of June. The power generation is highest in summer, around 30 to 35%. The curves start descending after summer. Another thing to note is both photovoltaic and thermal power plants have similar trends; there is not much difference between the two.
The direction of your solar panels (or roof) and their slope
The direction of your solar panels is a crucial element. Solar panels facing in the wrong direction can substantially limit the output of the system. Consequently, the capacity factor of the system decreases. In the US, the south direction is the ideal choice. If your roof is not facing in the south, west and southwest also work well.
Apart from the direction, the slope or the angle of inclination is something we cannot ignore. The power generated by panels reaches a peak at a particular inclination angle, which is typically equal to the latitude of the location. If panels are fixed at a wrong angle, the generation capacity is likely to get affected.
Shading
The solar system converts falling sunlight into electricity. In many cases, sunlight itself gets blocked by shading. It may happen because of trees, neighboring buildings, or any other adjacent structure. In such circumstances, it is appropriate to relocate equipment. Otherwise, the system will yield lower power.
Geographical location
The geographical location of solar systems also matters. The amount of sunlight received by different regions of the earth is uneven. Countries closer to the equator get more sunlight than countries away from the equator. For example, the US is closer to the equator than the UK. So, a solar system with the same nameplate capacity will generate more power in the US than in the UK. This is also true within a country. Southern states of the US have more solar potential than the northern states.
How to calculate the solar capacity factor?
To calculate the capacity factor, we need to determine the ratio of the energy output of the system over a certain period of time to the maximum possible rated power of the system, which is the nameplate capacity.
Here is a simple formula to calculate the solar capacity factor (CF).
CF = (energy output in kW h) / (time in hour × nameplate capacity in kW).
Usually, the energy output of residential and medium-sized commercial projects is measured in the kilowatt-hour (kW h) and the nameplate capacity in the kilowatt (kW).
Example: A residential photovoltaic system has a nameplate capacity of 30 kW. In July 2019, it produced 6,700 kW h of energy. At the end of the year, the total annual energy generated was 60,500 kW h. Find the monthly and annual capacity factor?
So, the nameplate capacity, which is the rated capacity, is 30 kW. And in July, the electrical output was 6,700 kW h and in that year 60,500 kW h.
Capacity factor in July = (6,700) / (31 × 24 × 30) = 30.02%.
Capacity factor in 2019 = (6,700) / (365 × 24 × 30) = 23.02%.
In the case of solar utility plants, the energy outputs are high and reported in the megawatt-hour (MW h) and the nameplate capacity in the megawatt (MW).
Example: Topaz solar farm has a nameplate capacity of 550 MW. In 2019, the total annual output was 1,255,722 MW h. What is the capacity factor of the farm?
Capacity factor = (1,255,722) / (365 × 24 × 550) = 26.06%.
The capacity factors are mainly reported for years. But you can calculate monthly as well, like in one of the previous examples.
CFAC and CFDC
Sometimes we will see the capacity factor published as CFAC or CFDC. What do they mean? AC stands for alternating current and DC for direct current.
When sunlight falls on solar panels, it produces DC. This DC, when passed through inverters, gets transformed into AC, which is the final output of the solar system. This final output also goes to the metering device. Thus, when you measure the power generation of your solar system, it will more likely be AC. To be more precise, the measured power output will always be in kW hAC. Speaking of the nameplate capacity, things are different. The nameplate capacity can be reported in DC or AC. To avoid any confusion, we add the respective suffix to CF to indicate which nameplate capacity is used during the calculation.
CFAC = (power output in kW hAC) / (time in hour × nameplate capacity in kWAC).
CFDC = (power output in kW hAC) / (time in hour × nameplate capacity in kWDC).
The nameplate capacity in kWDC will always be more than kWAC. As a result, CFAC is always larger than CFDC.
Example: A 6 KWDC rated solar array produces 9,400 kW hAC annually. Its AC rating is 5 kW hAC. Find CFAC and CFDC?
CFAC = (9,400) / (365 × 24 × 5) = 21.46%.
CFDC = (9,400) / (365 × 24 × 6) = 17.88%.
Theoretical capacity factor
An alternative approach to estimate the capacity factor is by calculating the theoretical value. We can calculate the theoretical capacity factor only based on the location of the solar system. There is no need to know how big the system is or how much power it produces.
Every place on the earth received a quantifiable amount of sunlight, which is expressed in average peak Sun hours for that place. Since the amount of energy generated is directly proportional to peak Sun hours, we calculate the theoretical capacity factor from the formula below.
CF = (peak Sun hours for a place) / (24 hours).
For example, Los Angeles gets peak sunlight for 5.6 hours. So, the theoretical capacity factor for the region is 5.62/24 = 23.34%.
Of course, this estimate does not include parameters like shading, the direction of panels. So, your actual capacity factor might be less than this estimate.
Solar capacity factor compared to other fuels
When we look at the capacity factor of other fuels, solar has the worst number. We can notice that from the graph below. Solar utility power plants have a capacity factor of around 24.5%. Wind and geothermal follow solar. On the better side, nonrenewables and nuclear power plants operate very well. Nuclear has the highest capacity factor, above 90%.

The reason why solar and other renewable plants give lower power generation is the lack of the availability of energy supplies. We cannot control the sun, wind, and water. These energy sources change with time. On the other hand, coal, natural gas, and uranium are tangible energy sources. We stockpile them.
Can the solar capacity factor be improved?
Solar systems are completely at the mercy of the sun and nature. And we cannot change nature. It is not possible to increase the solar capacity factor beyond a certain point because we cannot eliminate nights. However, some simple improvements can be achieved if there are external parameters that affect energy conversion, like shading. Other than that, we will never have the solar capacity factor as high as nonrenewables unless the solar system is in outer space.
The graph below projects the capacity factor of solar utilities from 2014 to 2019. As we can see, the numbers are constant and remain unchanged.

Solar capacity factor by states
Since the US is a very vast nation with diverse geography, solar irradiance is different for different states of the US. Some states, especially southern western US states, receive more sunlight than others. So, these states have higher peak sun hours and consequently a larger capacity factor.
In the graph below, we can see Arizona performs best; it has the highest capacity factor, around 29.1%. Utah, California, and Nevada follow the rank. The northeastern states, such as Massachusetts and New Jersey, have the lowest capacity factor.

Note: These figures are for photovoltaic utility plants. PV Utility plants are pretty advanced and use trackers to maximize power generation. Residential and commercial photovoltaic systems normally have lower capacity factors than utility-scale plants. If your solar system is getting over powered be sure to install solar fuses to ensure that your panels wiring does not get fried.
The above data in the tabular format is as follows:
| US states | Capacity factor |
|---|---|
| Arizona | 24.7% |
| Utah | 29.1% |
| California | 29.0% |
| Nevada | 28.4% |
| Texas | 27.8% |
| Georgia | 23.2% |
| North Carolina | 21.0% |
| New Jersey | 16.8% |
| Massachusetts | 16.5% |
| US average | 24.7% |